Where More Prospects Have Diabetes: 50 States of Trend Data

News April 29, 2020 at 04:40 PM
Share & Print

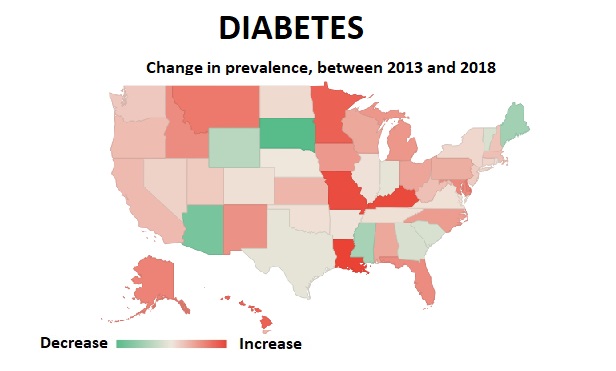
A U.S. map showing that most of the country is getting more diabetes, but that South Dakota and Arizona seem to be moving in a good direction. (Credit: Allison Bell/ALM)

Diabetes tends to go with obesity like a pint of ice cream with another pint of ice cream.

Diabetes can lead a client who seemed perfectly healthy into a whole new world of chronic disease management.

It can also lead to serious health problems, such as kidney disease, and it can make almost any other problem, including COVID-19, more deadly.

It's also consuming a large and growing share of government spending around the world, and especially in the United States.

The U.S. Centers for Disease Control and Prevention (CDC) collects data on diabetes through many programs, including the Behavioral Risk Factor Surveillance System (BRFSS) survey program.

More articles in this Health Data Atlas collection:

For a financial professionals, diabetes trends among people with household income over $50,000 per year may be more relevant than averages for the general population.

We mined BRFSS data for a map that shows how the percentage of high-earning adults with diabetes changed between 2013 and 2018.

For trend data for all 50 states and the District of Columbia, see the table below.

.

Diabetes

The percentage of adults, with annual household income over $50,000, who say they have diabetes.
 "Diabetes" refers to conditions that interfere with the body's production or use of insulin, a hormone that helps cells take sugar from the blood. The CDC behavioral risk survey diabetes figures leave out pre-diabetes and gestational diabetes.
Location 2013 2018

Change in Percentage Points

Alabama 8.5 10.0 1.5
Alaska 5 7.0 2.0
Arizona 8.8 7.5 -1.3
Arkansas 8.8 9.4 0.6
California 7 8.2 1.2
Colorado 4.5 5.2 0.7
Connecticut 6.1 6.9 0.8
Delaware 6.9 9.0 2.1
District of Columbia 4.2 3.8 -0.4
Florida 7.5 9.4 1.9
Georgia 8.4 8.6 0.2
Guam 12.4 10.6 -1.8
Hawaii 6.9 9.4 2.5
Idaho 5.5 7.4 1.9
Illinois 7 7.6 0.6
Indiana 8.3 8.7 0.4
Iowa 5.3 7.0 1.7
Kansas 6.8 8.1 1.3
Kentucky 6.8 9.7 2.9
Louisiana 7.5 10.5 3.0
Maine 6.7 6.0 -0.7
Maryland 7.7 9.6 1.9
Massachusetts 5.2 6.3 1.1
Michigan 6.4 8.1 1.7
Minnesota 4.1 6.6 2.5
Mississippi 9.2 8.6 -0.6
Missouri 6.7 9.5 2.8
Montana 4.8 7.0 2.2
Nebraska 6.9 7.5 0.6
Nevada 7.2 8.1 0.9
New Hampshire 6.5 7.6 1.1
New Jersey 7.5 8.5 0.9
New Mexico 6.8 8.6 1.8
New York 6.9 7.7 0.8
North Carolina 7 8.7 1.7
North Dakota 6.2 6.9 0.7
Ohio 6.8 8.3 1.5
Oklahoma 8.7 9.4 0.7
Oregon 7 8.2 1.2
Pennsylvania 6.5 7.9 1.4
Puerto Rico 6.3 11.2 4.9
Rhode Island 5.7 6.4 0.7
South Carolina 9 9.2 0.2
South Dakota 7.3 5.5 -1.9
Tennessee 7.8 8.5 0.6
Texas 7.5 7.9 0.4
Utah 5.4 6.4 1.0
Vermont 4.9 5.1 0.2
Virginia 6.4 7.0 0.6
Washington 6.2 7.2 1.0
West Virginia 8.6 9.7 1.1
Wisconsin 4.9 6.4 1.5
Wyoming 6.3 6.0 -0.3
MEDIAN 6.8 8.1 1

.

— Read 10 States Where Stroke May Hurt Your Saleson ThinkAdvisor.

— Connect with ThinkAdvisor Life/Health on FacebookLinkedIn and Twitter.

NOT FOR REPRINT

© 2024 ALM Global, LLC, All Rights Reserved. Request academic re-use from www.copyright.com. All other uses, submit a request to [email protected]. For more information visit Asset & Logo Licensing.

Related Stories

Resource Center