 (Image: CDC)
U.S. COVID-19 pandemic numbers are continuing to look better — but many indicators are still worse than they were in April, when the first wave of COVID-19 deaths was cresting.
Members of the Data Strategy and Execution Workgroup, part of the White House COVID-19 team, have published some of the new pandemic intensity tracking figures in their new set of weekly state profile reports.
Officials at the U.S. Centers for Disease Control and Prevention (CDC) have published other figures in the first issue of the COVID Data Tracker Weekly Review. The CDC replaced its old COVIDView report series with the new COVID Data Tracker report series starting Feb. 12.
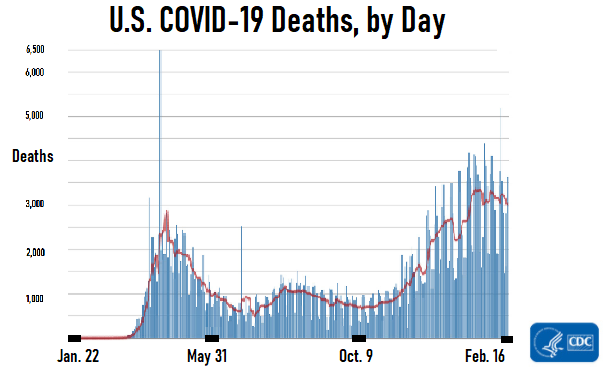
The United States has had three major waves of COVID-19 cases so far. One crested in April 2020, the second crested in July 2020, and the third crested last month.
Pandemic Intensity Data
Here's what happened to some of the key national COVID-19 indicators between the week ending Feb. 5 and the week ending Feb. 12.
- New Cases per 100,000 People: 205 (down from 263)
- Percentage of People Tested Who Had COVID-19: 6.6% (down from 7.8%)
- New COVID-19 Hospital Admissions per 100 Beds: 8 (down from 10)
- COVID-19 Deaths per 100,000: 6.5 (down from 6.8)
- Nursing Homes With 1 or More New Resident COVID-19 Deaths: 8% (down from 11%)
The Waves
The CDC makes up for the impact of weekends on data reporting by looking at "seven-day moving averages," or the average number of items reported each day over a seven-day period.
Here's what's happened to the seven-day moving averages for new cases and deaths.
New Cases
- Now: About 100,000 per day.
- The Early-January Peak: About 250,000 per day.
- The Spring Peak: About 32,000 per day.
The increase in the seven-day moving average number of new cases may be due partly to increased access to COVID-19 testing, but the number of deaths has also been high.
Deaths
- Now: About 3,000 per day.
- The Early-January Peak: About 3,300 per day.
- The Spring Peak: About 2,900 per day.
The seven-day moving average number of deaths stayed over 2,000 for only about two weeks in the spring but has already been over 2,000 per day for 10 weeks during the wave occurring now.
2020 Mortality
For all of 2020, the total number of U.S. deaths from all causes was about 3.4 million, and about 18% higher than the expected number, according to the CDC.


