Third Wave of COVID-19 Continues to Ease

February 17, 2021 at 06:33 PM
Share & Print

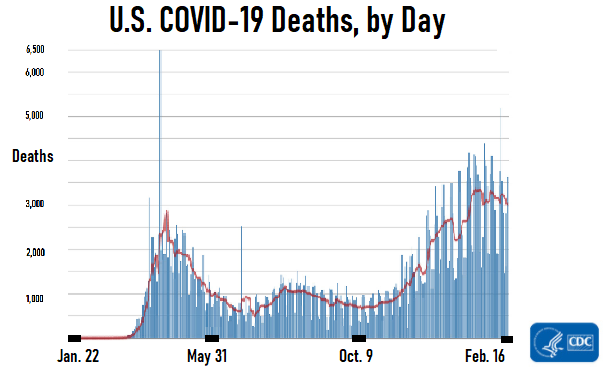
A chart showing that the third wave of deaths is easing, but that the average number of COVID-19 deaths per day is still higher than it was in March and April, when everyone was scared. (Image: CDC)

U.S. COVID-19 pandemic numbers are continuing to look better — but many indicators are still worse than they were in April, when the first wave of COVID-19 deaths was cresting.

Members of the Data Strategy and Execution Workgroup, part of the White House COVID-19 team, have published some of the new pandemic intensity tracking figures in their new set of weekly state profile reports.

Officials at the U.S. Centers for Disease Control and Prevention (CDC) have published other figures in the first issue of the COVID Data Tracker Weekly Review. The CDC replaced its old COVIDView report series with the new COVID Data Tracker report series starting Feb. 12.

The United States has had three major waves of COVID-19 cases so far. One crested in April 2020, the second crested in July 2020, and the third crested last month.

Pandemic Intensity Data

Here's what happened to some of the key national COVID-19 indicators between the week ending Feb. 5 and the week ending Feb. 12.

  • New Cases per 100,000 People: 205 (down from 263)
  • Percentage of People Tested Who Had COVID-19: 6.6% (down from 7.8%)
  • New COVID-19 Hospital Admissions per 100 Beds: 8 (down from 10)
  • COVID-19 Deaths per 100,000: 6.5 (down from 6.8)
  • Nursing Homes With 1 or More New Resident COVID-19 Deaths: 8% (down from 11%)

The Waves

The CDC makes up for the impact of weekends on data reporting by looking at "seven-day moving averages," or the average number of items reported each day over a seven-day period.

Here's what's happened to the seven-day moving averages for new cases and deaths.

New Cases

  • Now: About 100,000 per day.
  • The Early-January Peak: About 250,000 per day.
  • The Spring Peak: About 32,000 per day.

The increase in the seven-day moving average number of new cases may be due partly to increased access to COVID-19 testing, but the number of deaths has also been high.

Deaths

  • Now: About 3,000 per day.
  • The Early-January Peak: About 3,300 per day.
  • The Spring Peak: About 2,900 per day.

The seven-day moving average number of deaths stayed over 2,000 for only about two weeks in the spring but has already been over 2,000 per day for 10 weeks during the wave occurring now.

2020 Mortality

For all of 2020, the total number of U.S. deaths from all causes was about 3.4 million, and about 18% higher than the expected number, according to the CDC.

In January 2020, when executives from Reinsurance Group of America Inc., a reinsurer, were talking generally about what RGA classified as a severe pandemic, they gave figures implying that they would see a 17% increase in the overall U.S. mortality rate as a 200-year mortality event.

RGA and other insurers have said in recent weeks that the COVID-19 pandemic has caused a significant increase in life insurance claims, but not as great of an increase as they had originally feared, because mortality has been much lower for people covered by life insurance than for members of the general U.S. population.

Forecasts

CDC analysts use forecasts from a wide range of government, academic, commercial and independent nonprofit sources to create a consensus forecast chart.

The latest CDC consensus chart shows that the number of new COVID-19 cases is likely to continue to fall at least through March 15.

One factor that could make the intensity figures look better than expected, and push the number of new U.S. cases close to zero, is progress with getting people vaccinated against severe acute respiratory syndrome coronavirus 2 (SARS-CoV-2), the virus that causes COVID-19.

Overall, as of Feb. 11, about 35 million of the 330 million U.S. residents had received at least one dose of the vaccine, 11 million people had received two doses, and public and private teams were vaccinating an average of about 1.6 million people per day.

A factor that could lead to a fourth big wave of COVID-19 cases would be a new SARS-CoV-2 variant that spreads easily and fails to respond to the new COVID-19 vaccines.

In the new COVID Data Tracker Weekly Review, for example, CDC officials have included a map showing where public health officials have detected cases of COVID-19 caused by the SARS-CoV-2 variant B.1.1.7. That variant first emerged in the United Kingdom.

Officials have recorded just 981 B.1.1.7 cases in the United States, and laboratories have found that the current COVID-19 vaccines protect against that variant.

But "the emergence of variants, such as B.1.1.7, reminds us that we all need to re-double our efforts to prevent the spread of COVID-19," CDC officials write. "It is more important than ever that we all wear well-fitting masks, stay at least 6 feet apart from people we don't live with, avoid crowds and poorly ventilated spaces, and wash our hands often."

NOT FOR REPRINT

© 2024 ALM Global, LLC, All Rights Reserved. Request academic re-use from www.copyright.com. All other uses, submit a request to [email protected]. For more information visit Asset & Logo Licensing.

Related Stories

Resource Center